Analytics > AI Usage
AI Usage
The AI Usage report provides a comprehensive overview of your AI model consumption. It is designed to help you monitor costs, track resource utilization (tokens), and understand the environmental impact of your operations, all in one place.
Key Metrics
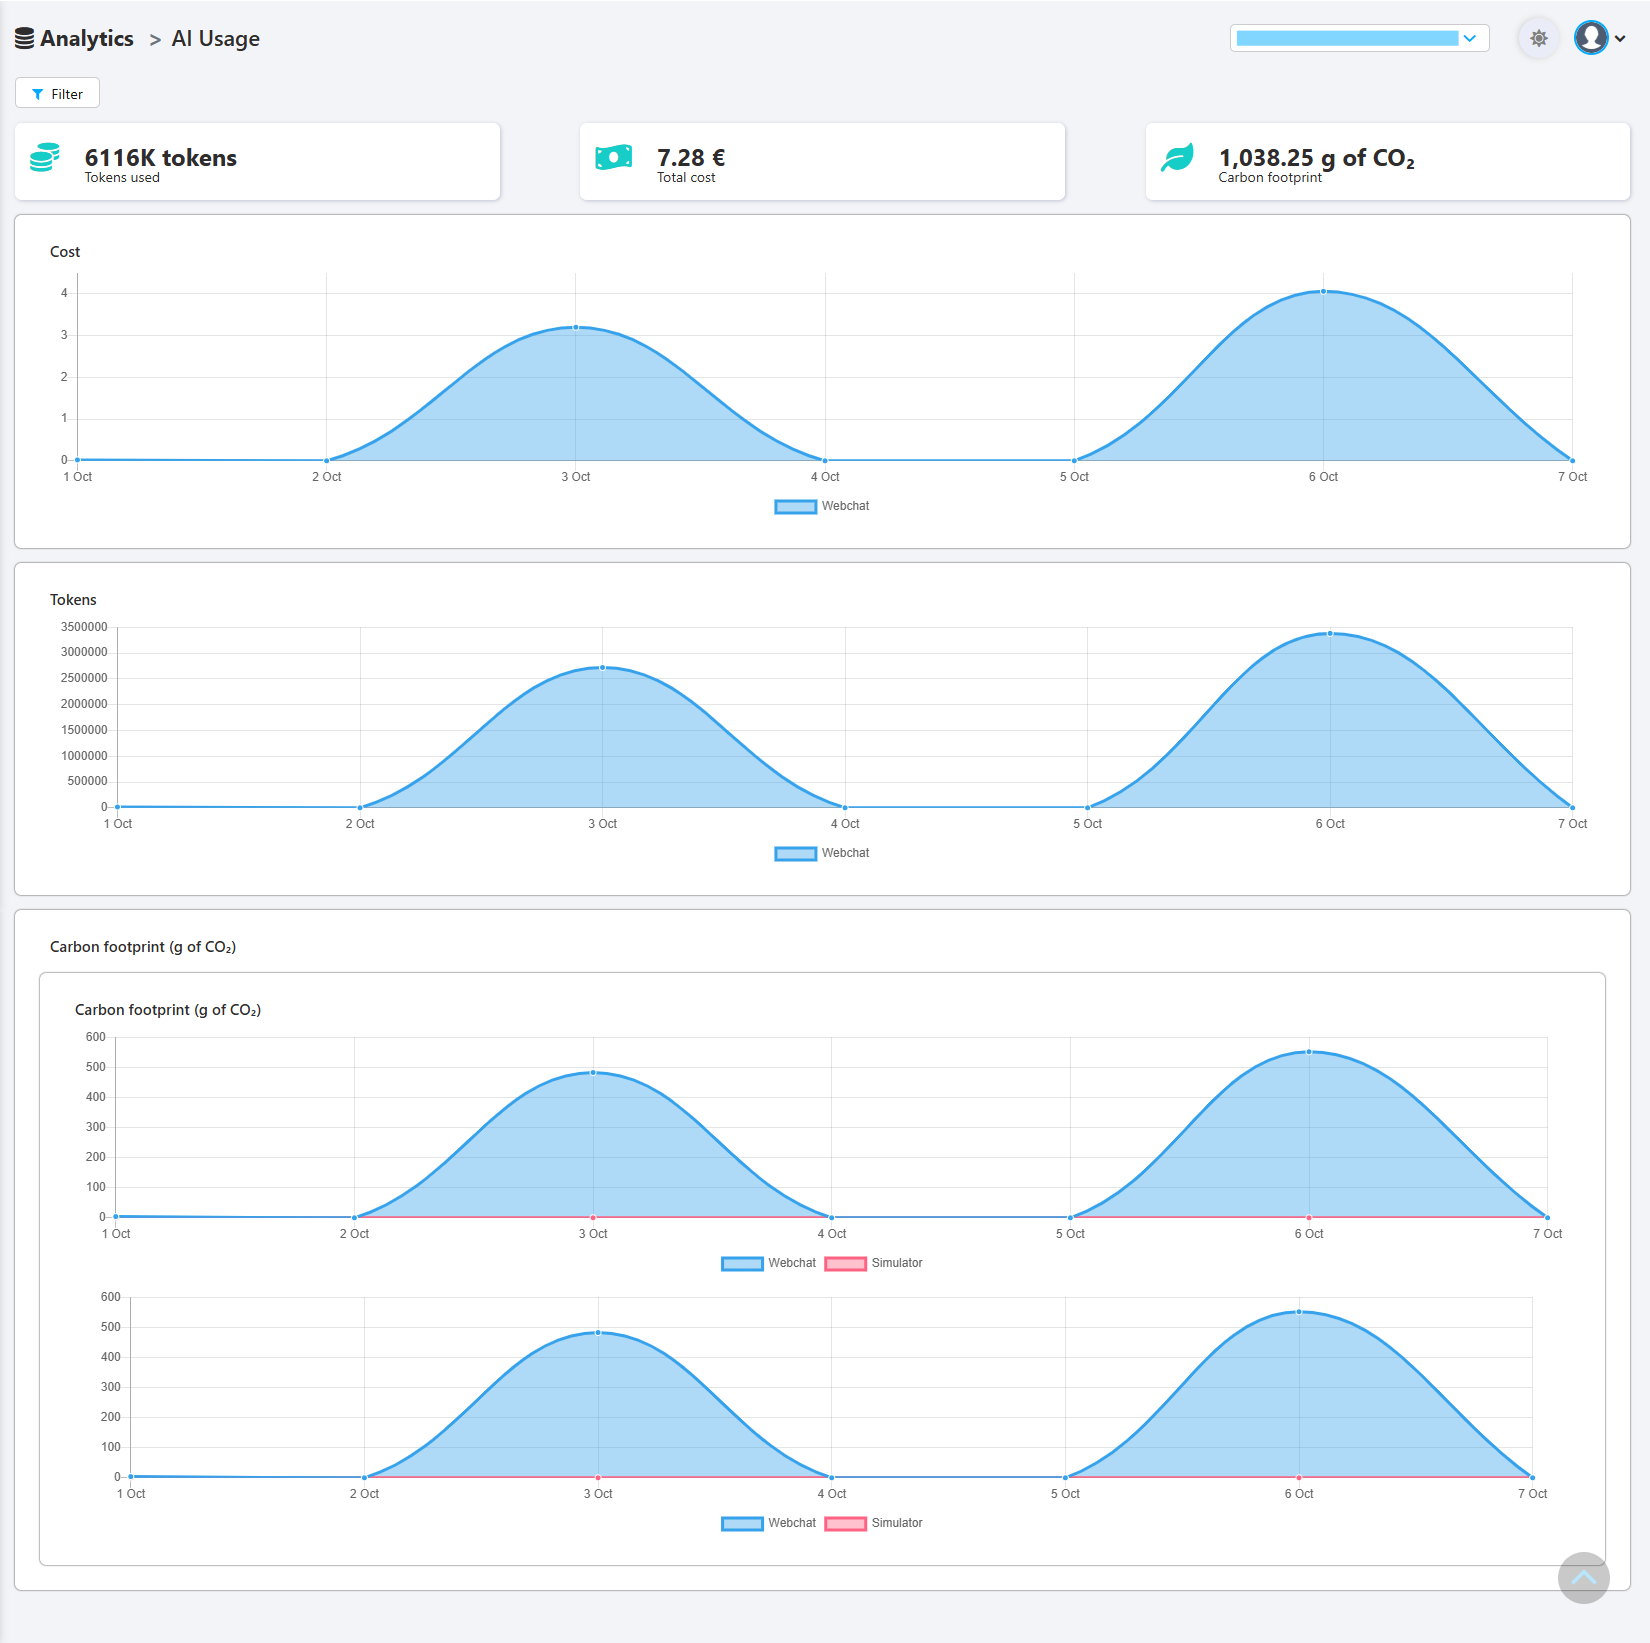
At the top of the page, you will find three main KPIs that summarize your AI consumption for the selected period:

- Tokens used: This shows the total number of tokens processed by the AI models. Tokens are the basic units of text that models use, so this metric is a direct measure of your AI workload.
- Total cost: This displays the cumulative financial cost associated with your token usage, allowing you to effectively monitor and manage your expenses.
- Carbon footprint: This provides an estimate of the CO₂ emissions generated by your AI operations, helping you track your environmental impact.
Usage Evolution Over Time
Below the key metrics, three detailed graphs visualize the daily evolution of your AI usage. Each graph breaks down the data by channel (e.g., Webchat, Simulator), allowing you to see where the consumption is coming from.
- Cost: This graph shows the daily fluctuation in your operational costs.
- Tokens: This graph tracks the number of tokens used each day, helping you identify peak activity periods.
- Carbon footprint (g of CO₂): This graph illustrates the daily environmental impact of your AI, making it easier to monitor trends and work towards sustainability goals.
Updated 9 months ago