Analytics > Sessions
The Sessions reports allows you to measure the activity of your bot in terms of conversations.
Below is the description of the different graphs you will find in this report.
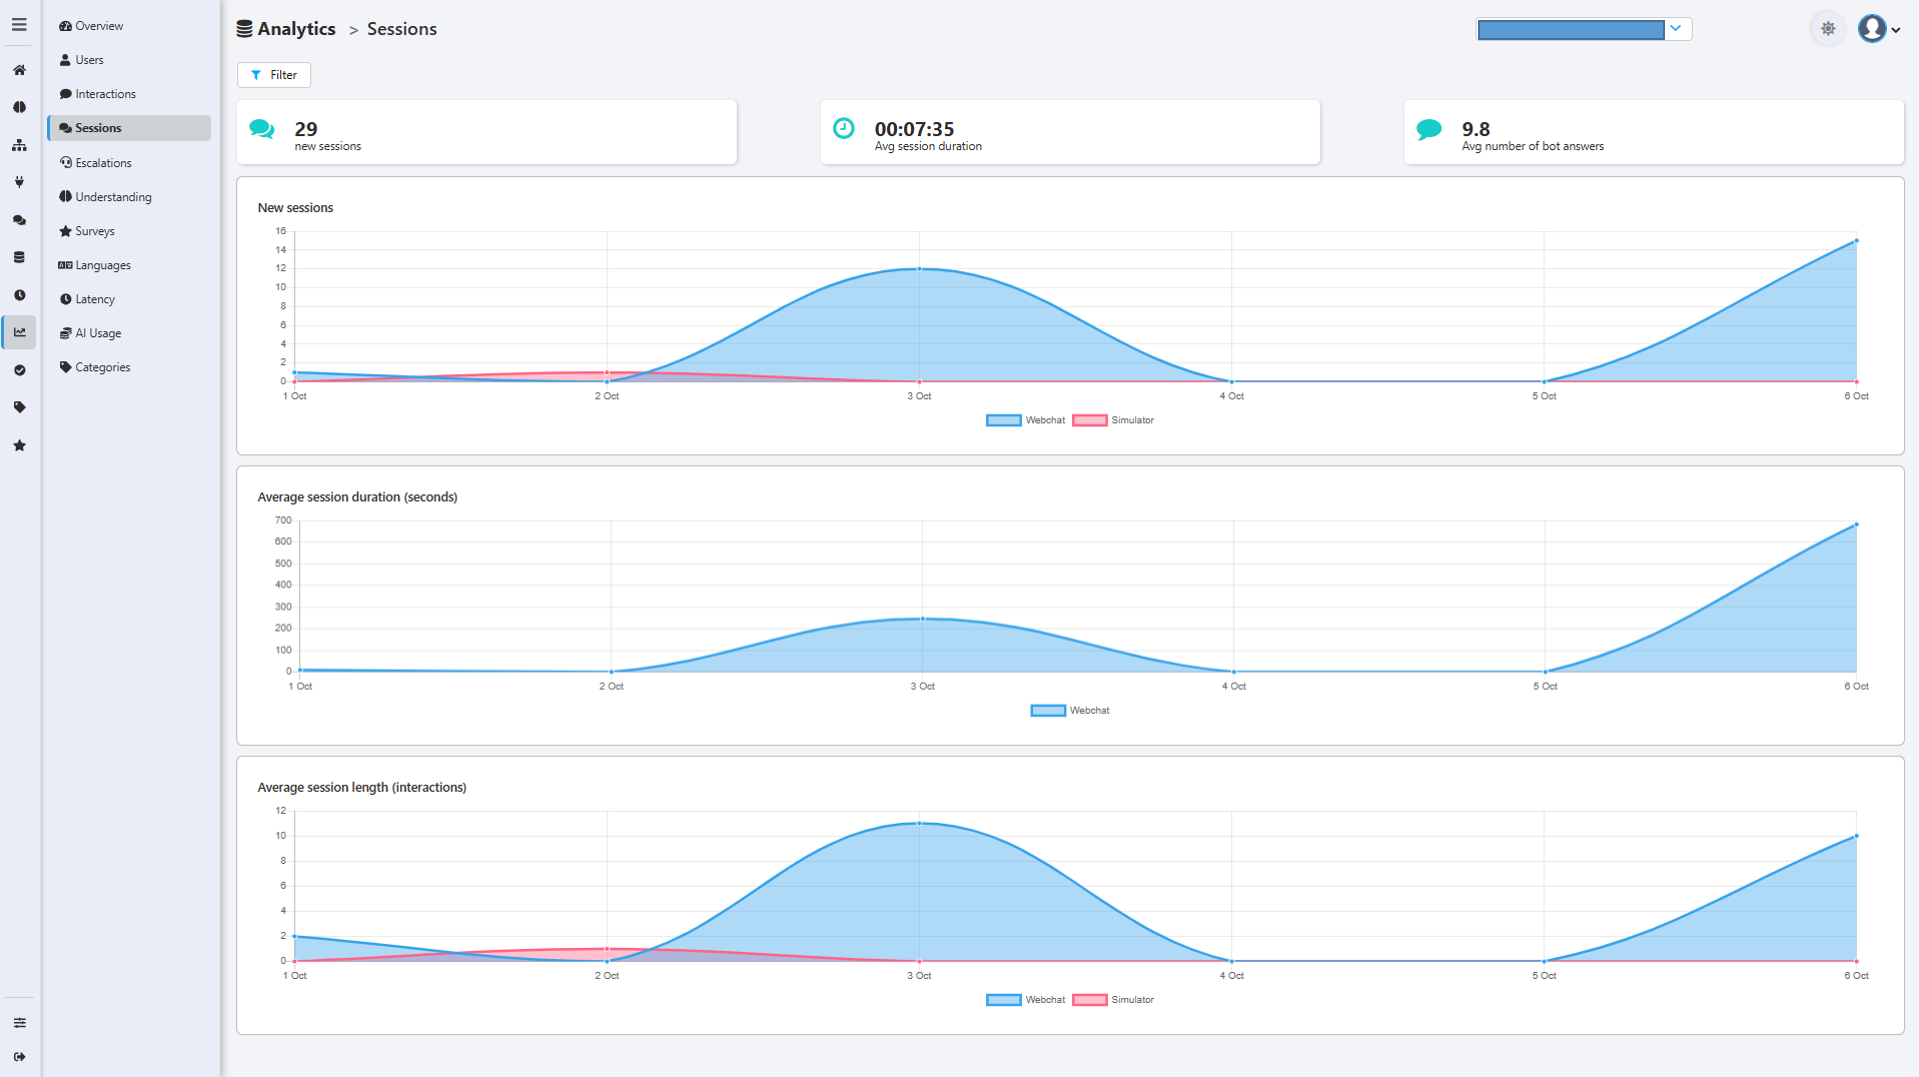
Key Numbers
At the top of the report, you fill find the following numbers for the selected period:

- New sessions: Defines the total number of conversations
- Average session duration: Defines the average duration of conversations
- Average number of bot answers: Defines the average number of user interactions per conversation
Then, you will find 3 graphs.
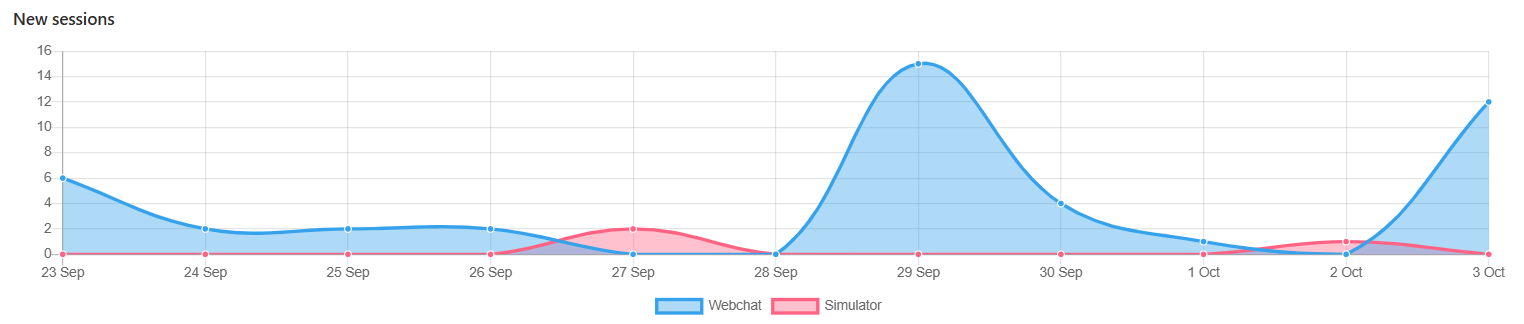
1 - Total number of sessions
This graph shows you the evolution of the total number of sessions processed by the bot during the period
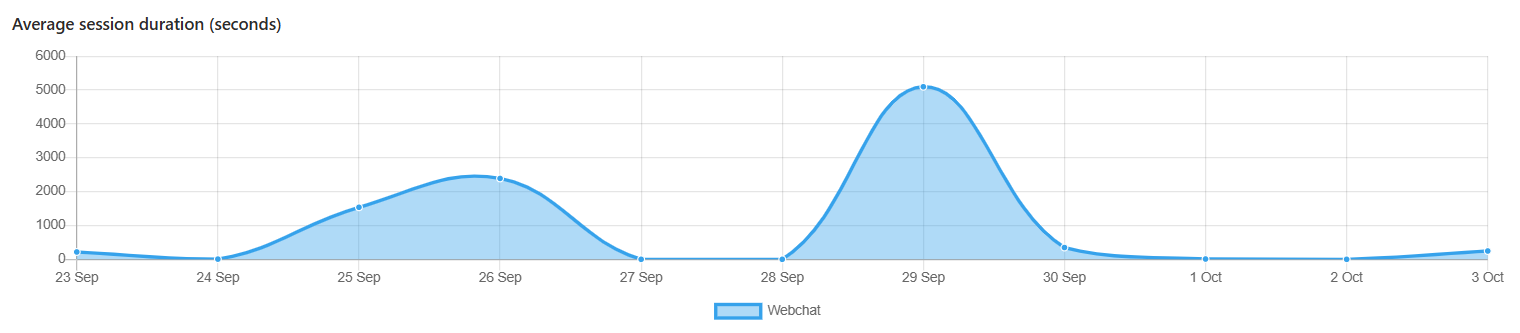
2 - Average session duration (seconds)
This graph allows you to see how long the conversations lasts, day by day, during the period.
Each point is the average duration of all the conversations that happened during the day.
3 - Average session lenght (interactions)
This graph allows you to see the evolution of the number of messages sent by the user to the bot during the conversations, during the period.
Each point represents the total number of user messages divided by the number of session during the day.
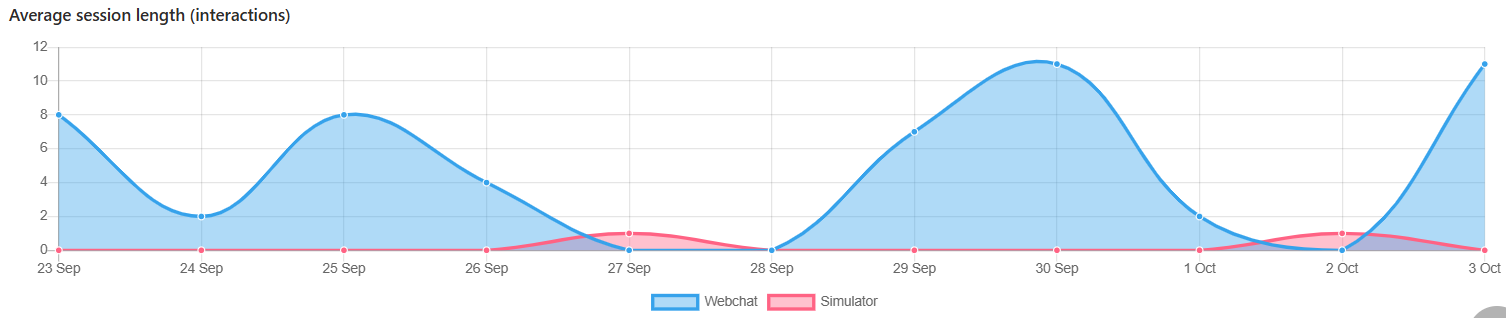
The sessions reports allows you to see how conversations have been processed by your bot.
Updated 9 months ago