Analytics > Categories
Gain valuable insights into the topics your users are discussing with the conversation categorization feature.
To activate this report, simply follow the steps outlined here.
Once the feature is enabled, this report will start displaying actionable data, including:
- The distribution of conversations across categories and subcategories.
- Keyword tags and trends associated with each category and subcategory.
Explore the screenshots below for a closer look at this feature and its powerful capabilities.
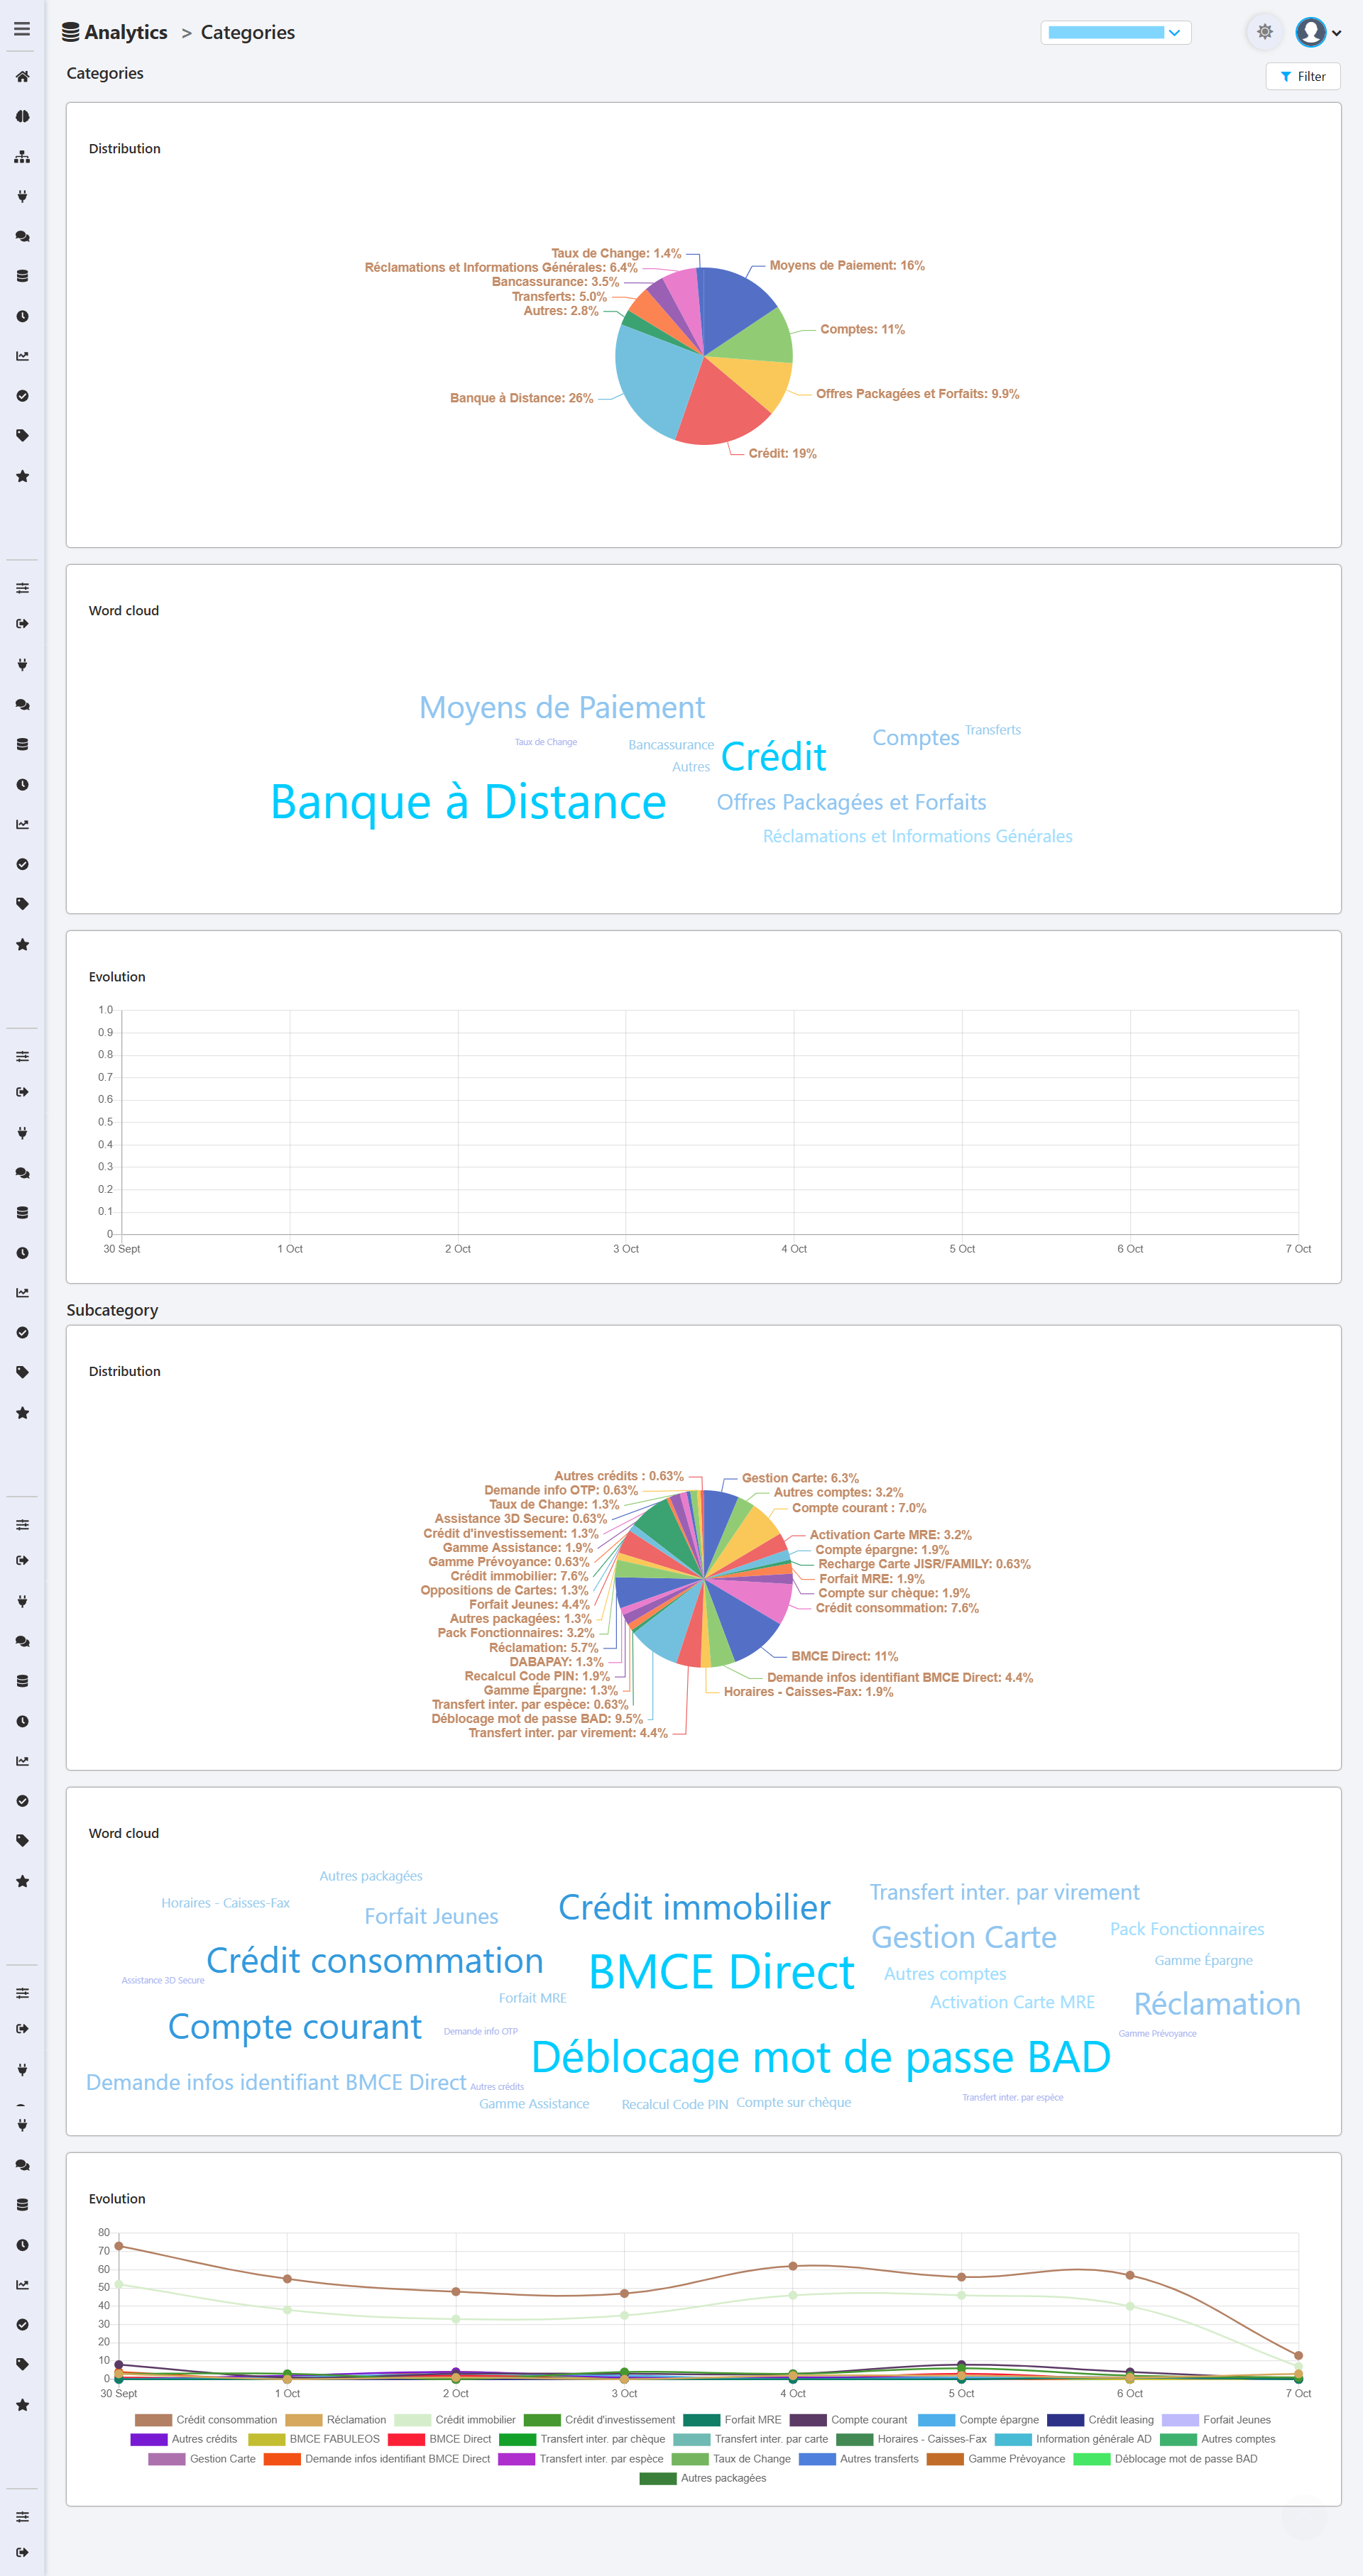
Categories
This section provides a high-level overview of the most discussed topics.
- Distribution: This pie chart visually breaks down the proportion of conversations for each main category. It allows you to see at a glance which topics are most dominant in your user interactions.
- Word Cloud: The word cloud offers an alternative visualization of the category distribution. The larger the name of a category, the more frequently it has appeared in conversations.
- Evolution: This line graph tracks the volume of each category over time. It's perfect for identifying emerging trends, seasonal topics, or the impact of a new product launch on user queries.
Subcategory
This section provides a more detailed, granular analysis by breaking down the main categories into specific sub-topics.
- Distribution: Similar to the category chart, this pie chart shows the distribution of all detected subcategories. It helps you pinpoint the most specific user needs with great precision.
- Word Cloud: This cloud visualizes the most frequent subcategories, giving you a quick summary of the most specific topics discussed.
- Evolution: The evolution graph for subcategories allows you to monitor trends at a much more granular level, tracking the day-by-day volume of specific issues or questions.
Updated 10 months ago